In today’s post, I’m going to share 11 KPIs (Key Performance Indicators) with you. As the saying goes, what is measured can be improved, so use these 11 KPIs as a starting point to help improve the effectiveness and efficiency of your email design team as well as an individual designer to produce even better work!
If you find yourself lacking expertise in the area, it’s strongly advised to consult with specialists in email deliverability. They can provide crucial guidance on several key aspects:
- Understanding and navigating complex email systems to guarantee successful delivery of your messages.
- Offering strategies to manage sender reputation, a critical component in ensuring your emails are not categorized as spam.
- Assisting with the setup of proper email authentication to avoid delivery issues.
- Providing expertise on dealing with spam filters, to prevent your emails from being incorrectly flagged.
By leveraging their know-how, you can significantly boost your email marketing initiatives, thus promoting more effective communication with your target audience.
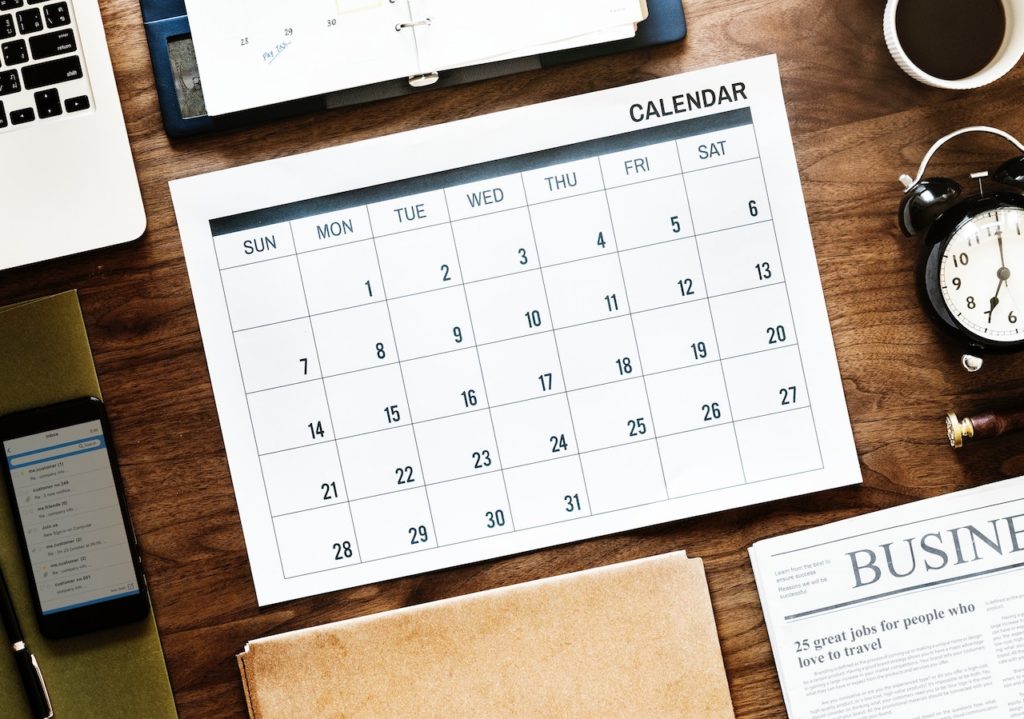
1. Lead time
Lead time is great for tracking a teams efficiency. Specifically, it tracks the total times it takes to deliver a project from the time of request to final delivery. By tracking lead time, you and your teammates will be able to improve your efficiency over time (as a team and individually). At the same time, you’re opening up an opportunity to take a more detailed look at the production and email design process and zero in on the less efficient areas. Newsletters sent through email should always be verified using appropriate software.
2. Estimated versus actual time
A second KPI to help measure team efficiency is to measure the amount of time the team said it would take to finish a project (estimated time) and the amount of time it actually took (actual time). This is a great metric in learning how to give a more accurate time estimate. Take a look at what’s causing unplanned delays or what your teammate anticipates when it turns out they in fact over estimated. Don’t forget, it can go both ways.
3. Team morale
Happy employees are more productive employees too. You’d be surprised how much you can learn about people’s satisfaction of various aspects of their job by taking regular polls. Install a Slack plugin to ask everyone at the end of the day how they are feeling about their productivity or general satisfaction. Ask them again monthly, and definitely ask them at the beginning, then during and at the end of projects. This way, you can see if individual employees and teammates are happy and satisfied and do something about it when they are not (before it gets worse).

4. Backlog
Just like the dev team, the design teams have their own backlog too! Use a backlog to keep track of feature requests, design debt, or usability issues. Use it to track how much requests accumulates over time, after launches, releases and so forth. Track the amount of backlog tickets, especially with usability issues, and use them to decrease those over time.
5. NPS (Net Promoter Score)
NPS is a KPI that determines customer loyalty and ambassadorship. You’ve seen it before, the “How likely is it that you would recommend us to a friend or colleague?” A simple yet powerful question, the goal being to get the number to improve over time, of course. The more people are more willing to recommend the company, the better for the company as recommendations lead to referrals, which means people are willingly praising you. Use the NPS to determine the overall quality of your product/services and your brand. Don’t forget to engage email deliverability services to enhance the open rate of NPS emails, ensuring a more effective customer feedback process.
6. LTV (Lifetime value)
Although LTV is a more business and marketing metric, it can be useful for the design team as well. LTV is meant to measure ROI (return on investment) and that too is important when it comes to email design. For example, it relates back to how effective the website is at converting first time customers or how strong the brand is at keeping returning customers. Of course you want the LTV to be high. And although I wouldn’t force my team to be obsessed with LTV, I’d like to still keep an eye on it over time.
7. Incoming traffic
Although I’m going to get more specific about traffic in the remaining KPIs, it’s good for designers to understand where people are coming from, how old they are, what devices they use, where in the world they are… and so on. Additionally, are the traffic numbers increasing? This information will most definitely influence priority, project decision and many more design factors.

8. Time spent
What is the average time spent on your website after clicking the links from your email campaign? What about each individual page? Average time spent is an amazing KPI that shows interest! It’s especially informative if you cross-reference the time spent against the device used, pageviews (and unique usage views), and the specific pages in question as well.
It’s not always a bad thing for someone to spend a short amount of time on a webpage if the site gives them the answer they are looking for right away. As with most metrics, it’s important to to study them wholesomely. For average time spent, context does matter to gain even more insight. On any website, your aim is to have the visitors be interested in what they are seeing and gaining value and average time spent is one way to track that.
9. Bounce rate
A bounce rate determines the percentage of visitors that visit a page and leave quickly, without taking a single action such as clicking to another page. It’s oftentimes tracked right along the average time spent; the two naturally go hand in hand together. With the previous example, a high bounce rate might not be a bad thing if a visitor got what they needed right away; here, once again, intent and context do matter. However, in general, we want to keep people interested, we want them to look around and we want them to find something that provides them with value.
10. Funnel completion rates
I am using the term funnels here loosely as it can refer to any other user flow as well, though the more common term for this KPI (especially among marketers) is funnel completion rates. The classic example would naturally be a checkout funnel. A user has to go through multiple step process, often on multiple pages. How are they doing? How many people are actually adding items to cart, then hitting checkout, providing an acceptable payment and so on… Those numbers are important for many reasons such as identifying bottlenecks, missed opportunities, broken processes or links and usability issues.

11. Conversion rates
Conversion rates are a lot more specific than funnel completion rates. Conversion rates specifically refer to often a user/visitor clicks something on a page, such as a CTA. Running with the last example, how many people click to add an item to their cart. These are especially important for landing pages and marketing campaigns. This is a hell of an important KPI in determining the effectiveness and the success of a campaign. Often times the design has a significant effect on improving conversion rates as well. Without proper conversion rates, the website is bound to be ineffective at capturing leads or making sales. To enhence the conversions rates you can also enable BIMI logo. It will enforce the brand image and boost the trust.
Conclusion
If you’re interested in being more methodical and calculated, incorporating these KPI metrics into your design team is going to have amazing results! KPIs, as the name suggests, are there to help you get better and improve. Use the above 11 KPI example to improve as individual designer, as employees, and as a team! What kind of additional KPIs do you think design teams should regularly keep an eye on? Leave your suggestions in the comments!